Create Metric Extension to Monitor Archivelog Gap on Standby
I want to monitor when a standby database falls behind a certain amount of archivelog files. I want to be able to do this no matter what platform or database version. I want to use a standard monitor across the database ecosystem. In this case I used metric extension to create my own metric for monitoring archivelog gap on standby database.
I want to monitor when a standby database falls behind a certain amount of archivelog files. I want to be able to do this no matter what platform or database version. I want to use a standard monitor across the database ecosystem. In this case I used metric extension to create my own metric for monitoring archivelog gap on standby database.
1. Login to OEM
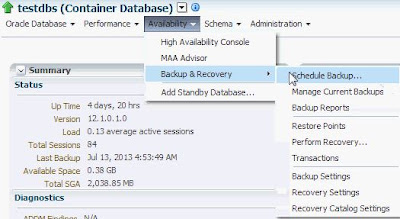
2. Click Enterprise>Monitoring>Metric
Extension
3. Click create
4. Fill in the information and set collection schedule as needed click next.
Target Type- Database Instance
Name- <any_name>
Display Name- <any_name>
Adapter- SQL
Description- <any_description>
5. Insert the SQL query below into the SQL Query box and click next. What this query is doing is selecting on the gv$archived_log table on the primary where arch dest is standby and appiled is yes. If a standby has not applied an archivelog then on the primary applied will be no. There are cases where mrp process has stop sending confirmation to the primary that archivelog have been applied in that case it is still an issue and this alert will give you notification to take action.
select sum(local.sequence#-target.sequence#) Total_gap
from
(select thread#,max(sequence#) sequence# from gv$archived_log where
dest_id=(select dest_id from v$archive_dest where TARGET='STANDBY'
)
and applied='YES' group by thread#) target,
(select thread#,max(sequence#) sequence# from gv$log group by thread#) local
where target.thread#=local.thread#;
6. Click add button to setup column info.
7. Fill in the information and click OK then next.
Name- column name
Display Name- how to display the column
Column Type- Data Column
Value Type- Number
Comparison Operator- Greater than or equal to what metric threshold needed
Set the advance values as needed
8. Set credentials as needed
9. Click add button to add target to test the metric.
10. Select a database to test and click select.
11. Click the run test button.
12. Testing progress will start
13. Test results will show up in test result section once complete click next.
14. Review the metric extensions setting and click finish.
15. You will now see the new metric extension but the status is editable. Select the new metric and click >action>save as deployable draft.
16. Now the status of the metric extension is deployable and you will be able to deploy the metric extension to database instance targets. Click action>deploy to targets.
17. Click add button
18. Select the target or targets to deploy the metric. In this case we have the primary database targets in a group called Data Guard Primary Databases.
from
(select thread#,max(sequence#) sequence# from gv$archived_log where
dest_id=(select dest_id from v$archive_dest where TARGET='STANDBY'
)
and applied='YES' group by thread#) target,
(select thread#,max(sequence#) sequence# from gv$log group by thread#) local
where target.thread#=local.thread#;
6. Click add button to setup column info.
7. Fill in the information and click OK then next.
Name- column name
Display Name- how to display the column
Column Type- Data Column
Value Type- Number
Comparison Operator- Greater than or equal to what metric threshold needed
Set the advance values as needed
9. Click add button to add target to test the metric.
10. Select a database to test and click select.
11. Click the run test button.
12. Testing progress will start
13. Test results will show up in test result section once complete click next.
14. Review the metric extensions setting and click finish.
15. You will now see the new metric extension but the status is editable. Select the new metric and click >action>save as deployable draft.
16. Now the status of the metric extension is deployable and you will be able to deploy the metric extension to database instance targets. Click action>deploy to targets.
17. Click add button
18. Select the target or targets to deploy the metric. In this case we have the primary database targets in a group called Data Guard Primary Databases.
19. Click the submit button to submit metric process will start.
Example of alert


