Wednesday, October 9, 2013

Windows Agents 12.1.0.2 Error while streaming JobReader:java.io.IOException

If you are getting similar issue on servers running Windows agent 12.1.0.2 during execution of OEM jobs apply patch 16521128.

Error Log:


ERROR: Failed to create command process Error while streaming JobReader:java.io.IOException: The pipe is being closed

Output Log:


G:OracleHomesagent12ccore12.1.0.1.0perlbin/perl execution failed: The system cannot find the path specified.

Bug

16600562

Patch

16521128

Installation Notes:

If you are applying this patch then it means you are most likely having issue execution jobs from OEM to a Windows server. If you follow the ready me file it will have you apply the patch using the provisioning tool. The issue with this is you can get the same error. The best thing to do is to apply the patch manually.

  1. Download the patch to the server where you are patching.
  2. Unzip the patch to a temporary folder
  3. Create node level blackout
  4. Shutdown the agent software “emctl stop agent”
  5. Create a backup of the agent home  <-optional but recommended
  6. Apply the patch 
  7. Cd to the temporary folder where patch was unzipped
  8. <agent_home>/OPatch/opatch apply -oh <agent_home>
  9. Restart the agent
  10. Remove blackout
  11. Now test

Reference

EM12c: Windows Agent Configuration Shows an Incorrect Value after Enterprise Manager Upgrade to Cloud Control 12.1.0.2 on Windows (Doc ID 1550995.1)

Friday, September 27, 2013

Solaris EM12c Secure Agent Failure During Deployment

During one of our Solaris agent deployment I came across this issue related to securing the agent.


You can see below the error you get during agent deployment on Solaris.
 1. First we need to update jvm options which you can see in my post here.


2. Secure agent
$cd $AGENT_HOME/bin
$./emctl secure agent

3. Start agent
$./emctl start agent

Note: If you see HTTP listener failed at startup you most likely have an exist running process.
4. Search for exist running java process from agent home
$ps -ef |grep java
5. Kill process
$kill -9 <pid#>

6. Start agent
$./emctl start agent
7. Config internal targets
$./emctl config agent internaltargets


8. Run root.sh
$cd $AGENT_HOME
$sh root.sh

Thursday, August 29, 2013

Use Corrective Actions to Automate Metric Alert Resolutions

In this demo I show how to configure corrective actions to automate the resolutions of metric alerts.

Corrective actions are processes that can be put in place at the metric level to execute when a threshold is reached.

In our QA database the testers have a bad habit of executing large DML processes with out notifying the DBA team. There processes can quickly generate 30G of archivelog in a 30 minute period which can easily fill up the archivelog area if the correct action is not taken to resolve the issue in a timely matter.

To automate the correct action to take when the archivelog area gets to a certain percent of usage we decided to create a corrective action. The corrective action will execute an RMAN archivelog backup and delete when the archive area used % reaches warning threshold 55%.

Environment

Database- 11.2.0.3 DBTEST1
Enterprise Manager- 12.1.0.2
Archive Area- +FRA01

Steps

Create Corrective Action in Library

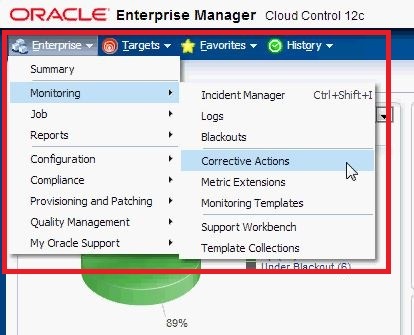
1. Log into OEM click Enterprise> Monitoring> Corrective Actions


2. Use the drop down and select RMAN script then click Go.


3. Give a name and if you like a description then click Parameters.


4. Type in the RMAN script box  "backup archivelog all not backed up delete all input;" If you already have a custom RMAN script you can give the full path to the script. Click Credentials.


5. Set the database and host credentials then click Access.


6. Set the access level for each account needed to view or make changes to the corrective action. Then click save to library.


7. The corrective action now has been successfully created in the corrective action library.


Add Corrective Action to Metric

8. Go to the database homepage of the database you want to apply the corrective action. Then click Oracle Database>Monitoring>Metric and Collection Settings


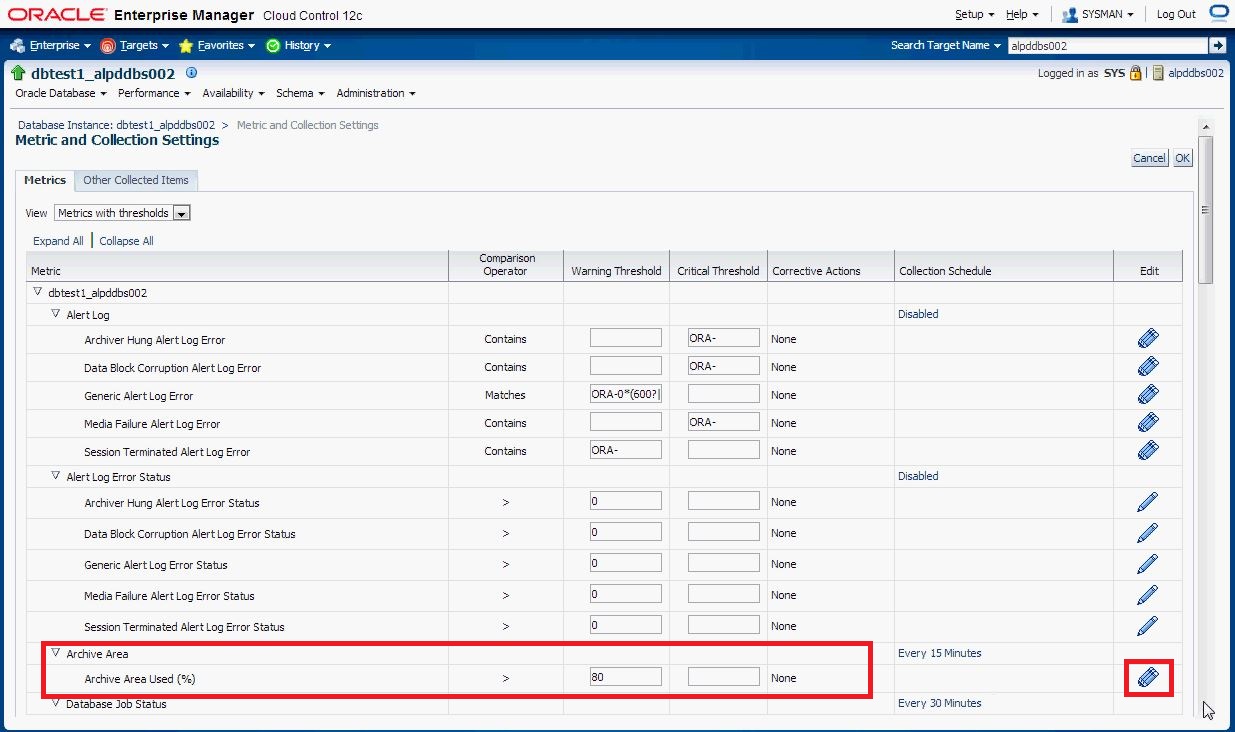
9. Find the Archive Area Used % metric and click the pencil icon to the right of the metric.


10. Set the warning and critical threshold if not already to a reasonable number for you environment. Then click Edit.

For my example I set the warning threshold to 55.


11. Click the Add button under corrective actions for warning threshold.


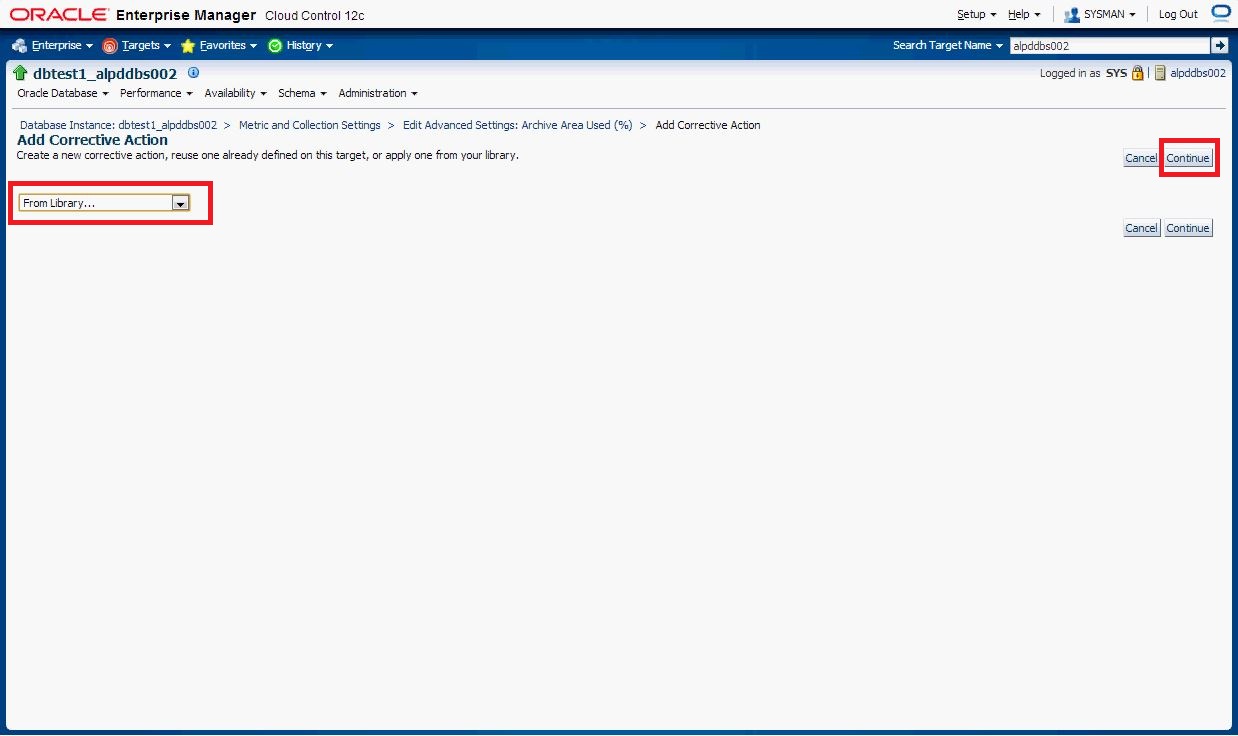
12. Use the drop down and select "from Library" click Continue


13. Select the name of the corrective action you are going to use in my case I selected the one we created in step 7. Click Continue


14. Give a name and description for the corrective action then click Parameters


15. We will keep the existing parameter as set in the library but if you wanted you can make changes as needed. Click Credentials


16. Set the database and host credentials as needed or leave set as from the library. Click Continue


17. You will now see that the metric has a corrective action set for warning threshold. Click Continue


18. You can see the corrective action now has warning only meaning the corrective action will only execute when the warning threshold is hit. Click Continue


19. Click OK to save the changes.


Review Metric

20. Click Oracle Database>Monitoring>All Metric


21. Expand the Archive Area an select Archive Area Used (%). We can see that currently the severity is green and the current % usage for archive area is 53%.


Check Current Usage

22. We can see that currently the FRA01 disk group is 54% used.


Load Kicks Off

23. I kick off my simple insert from select in a loop and begin to generate redo / archivelog. This begins to use more space in the archive area which is in the FRA01 diskgroup.


Check Archive Area Usage

24. We check the FRA01 diskgroup and we can now see that 57% is used.


Check Metric Alert

25. Our metric is now in a warning state since it has past the warning threshold of 55%.  Click the eye glasses under details.


26. We can see that the corrective action has executed at 8:47.


Check RMAN Process
27. At the OS level I grep for the RMAN process and we can see that RMAN process started at 8:49.


28. In the alert log we can see that at 8:50 RMAN issues the alter system archive log.


Check Archive Area Usage After Execution

29. We can see that the FRA01 diskgroup usage is back down to 51%.


Check Metric After Execution

30. We can see that our Archive Area Used (%) metric is now green and below the 55% warning threshold.


Conclusion 

Using corrective actions allows DBAs to be more proactive in implementing solutions. Corrective actions are also available in OEM version 10g and 11g.

Note:
You may ask why would QA be in archivelog mode due to go-live time line we can not take the chance of not being able to recover the database quickly to get the QA testers back in the system to continue testing. In this case we have setup the database in archivelog mode and execute nightly full backups.

Saturday, August 24, 2013

Create Pluggable Database using Enterprise Manager 12c

In this demo I show how to use Enterprise Manager 12c to provision new pluggable databases in a local container database. I will show how using Enterprise Manager 12c you can create more then one pluggable database for the same container with one provision operation.

Note: You need to have Enterprise Manager 12.1.0.2 or higher.

Environment

CDB- TESTDBS

Demo

In this demo I will show how using Enterprise Manager 12c I will create 3 new pluggable databases call TSTDB1, TSTDB2 and TSTDB3 all with one provisioning operation.


Steps

1. Log into Enterprise Manager 12c

2. Search for the container database that you will be provisioning a new pluggable database.

3.On the container homepage select Oracle Database>Provisioning>Provision Pluggable Databases

4. Select "Create Pluggable Databases" and click launch.

5. Set the database login credentials and click login.

6. Select "Create a new PDB" set the database host credentials and click next.

7. Set the PDB name, check the box to create multiple PDBs and set the number of PDBs to create. Give the name of the PDB local admin account you want to create and specify the password.

Note: The PDB name will be created as <PDBNAME># as stated in the message given below the number selection. 

8. Validation will begin this process checks that the pluggable databases names do not already exist.

9. Specify storage type and datafile location. Set a temporary working directory to store temporary files used during the provision operation. You can specify custom scripts to be executed after creation if needed. When done click next.

10 . Storage validation will begin this process check the storage location provided as will as the free space needed to create the pluggable databases.

11. Set deployment procedure name or leave default. Schedule as needed or leave the default of immediately and click next.

12. Review the create pluggable database sections and click submit.


13. Click the "View Execution Details" to review the job execution.

14. Expand the procedure steps and select the procedure step to review step details.

15. When the procedure completes all steps will show a status with a green arrow if the step was successful. You can also see the total elapsed time for the provisioning process. Select the create pluggable databases step and you will see step details for each PDB that was create.

In the search target name type the container name and click the search arrow button

16. You can now see that the three new pluggable databases are created and have been automatically added as targets to Enterprise Manager 12c.

17. On the container home page you can also see the newly provisioned pluggable databases.


My webpages
http://db12c.blogspot.com/
http://cloudcontrol12c.blogspot.com/

http://www.youtube.com/user/jfruiz11375

Follow me on Twitter